Running Reports
Running a report is straight forward. Simply navigate to TICKETS->REPORTS and click on the button with the name of the report you’re interested in. You should end up with a screen similar to this:
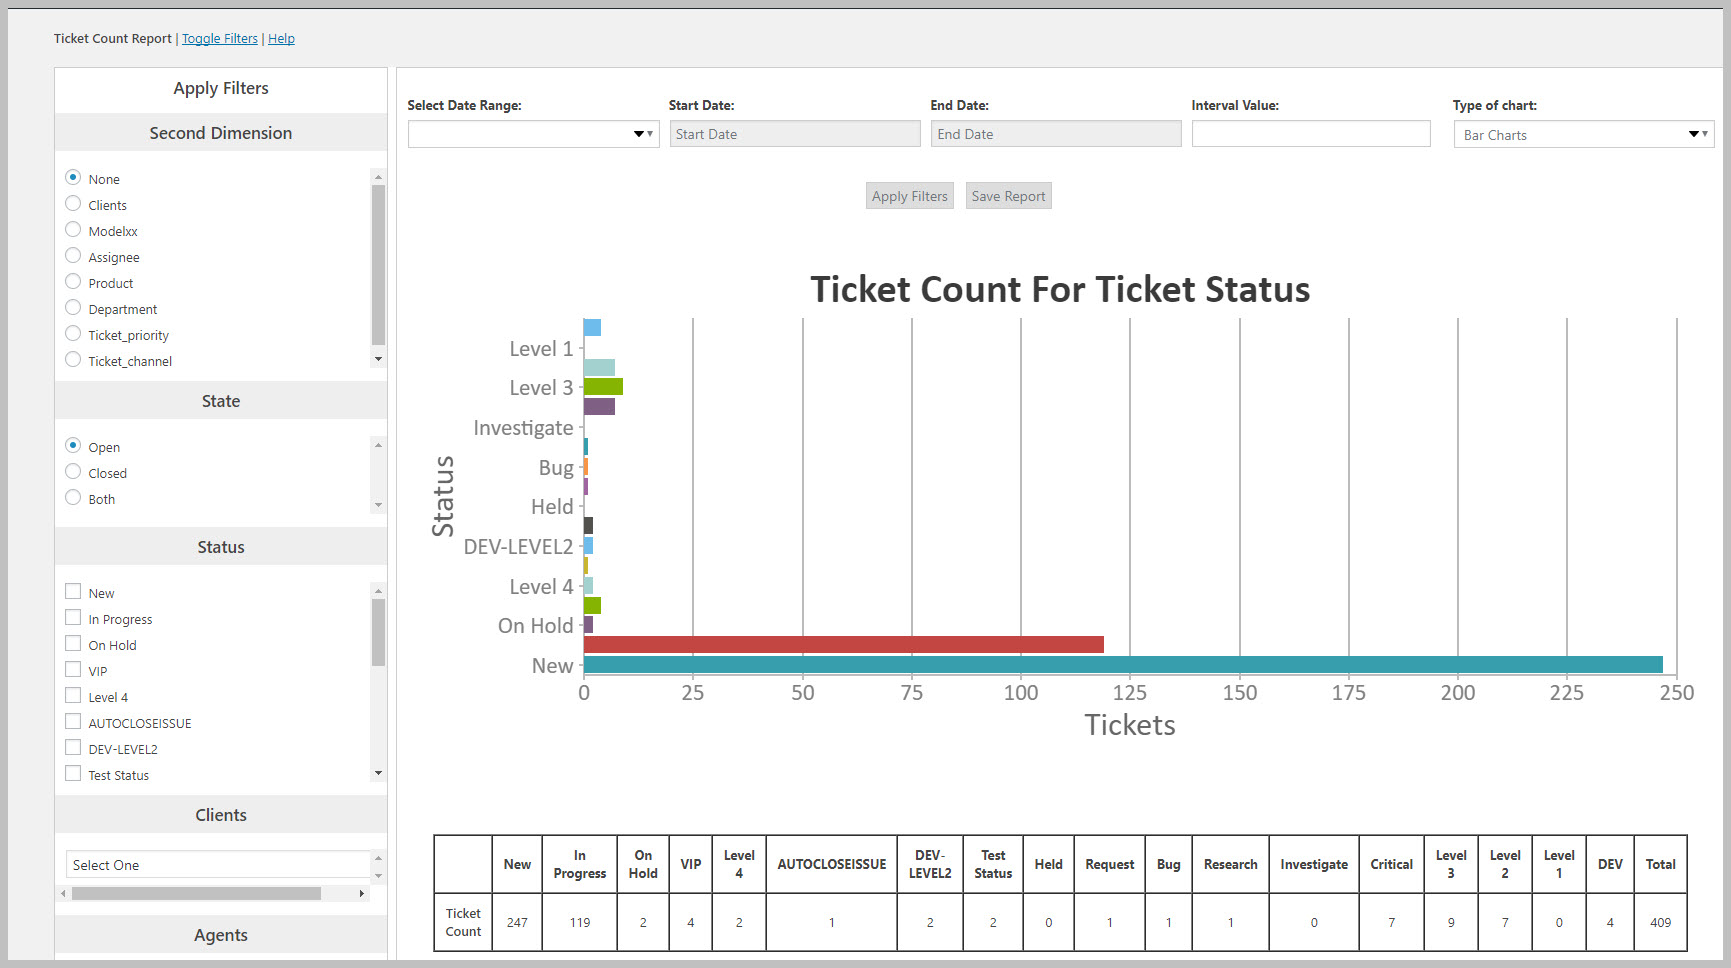
This screen hides some very powerful functions so lets examine each element individually. Below is the same image as above but with each important element labeled.
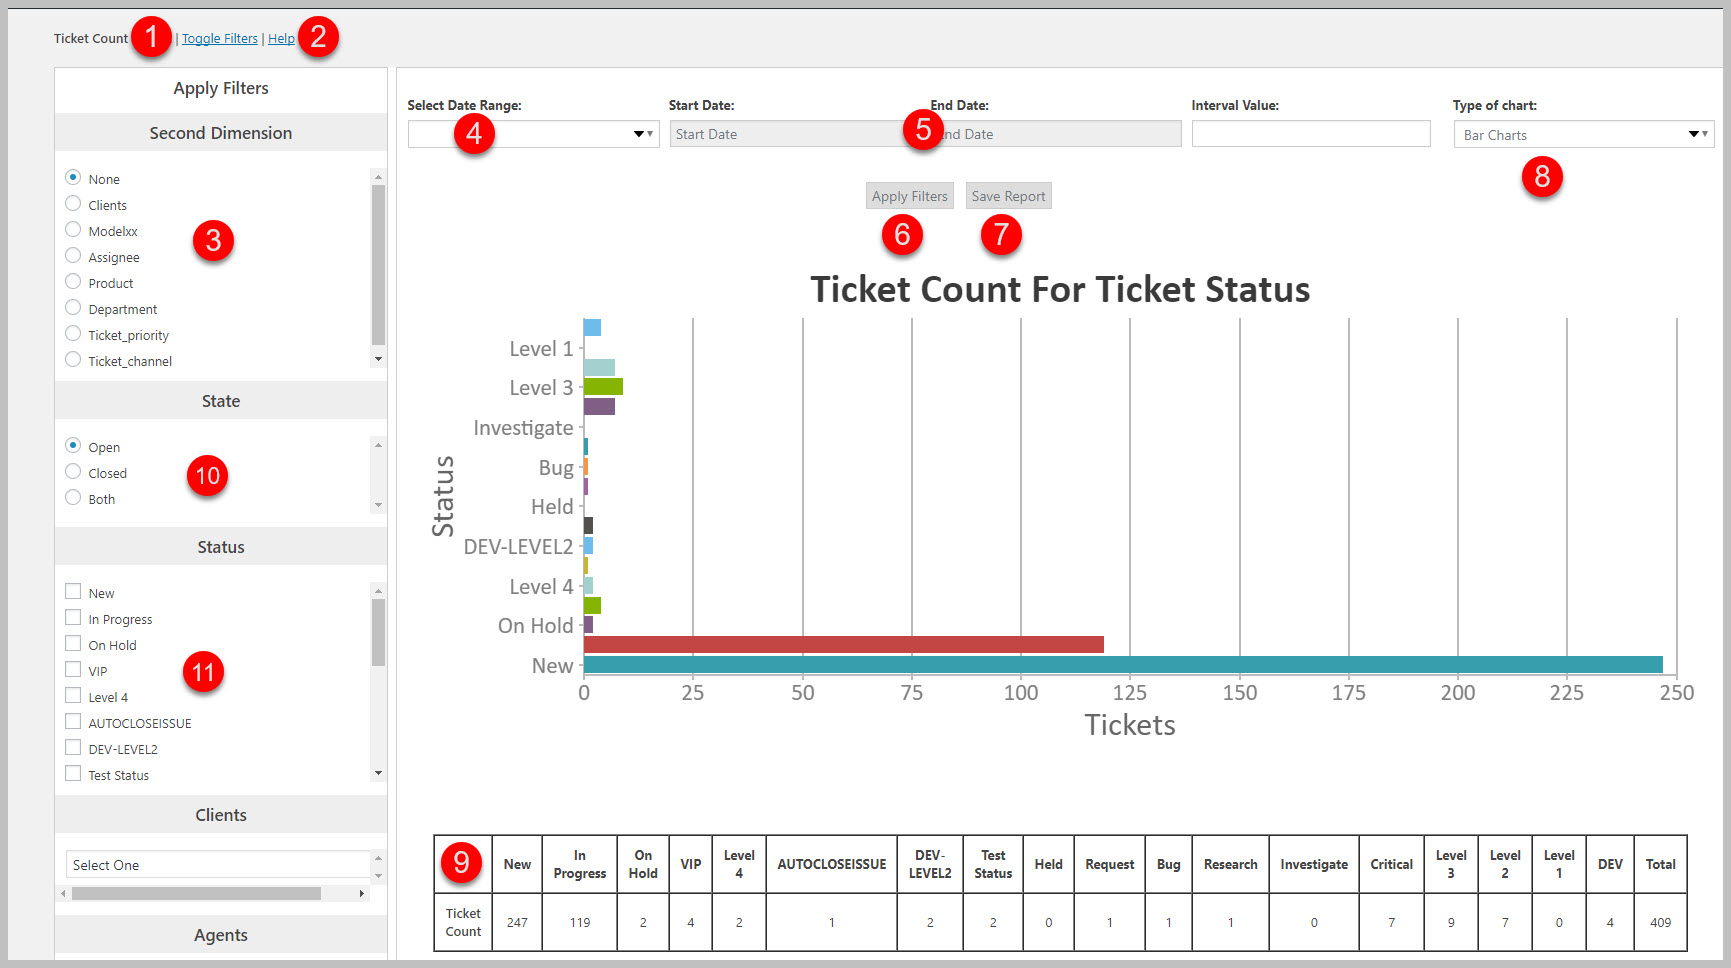
- TOGGLE FILTERS: This link is located on the upper left of the screen and shows or hides the filter side bar. By showing/hiding the filter sidebar you have the ability to expand the main report data area.
- The HELP / ABOUT link will reveal a sidebar on the right with more information about the report you’re viewing and, in some cases, give you hints about how to use the reports in your operation.
- The 2nd DIMENSION selection box allows you to break down any report using an additional dimension. In the example report above, no 2nd dimension is selected but if, say, the ASSIGNEE (Agent) dimension was selected then you would be able to see each individual ticket status count for each agent.
- The Date Range drop-down box allow you to quickly apply a date range to the report (Last month, this month, last week, this week, yesterday, today)
- The Start and End Date options allow you to restrict the reports by date. For most reports the date used is the date the ticket was opened. But for certain reports, the date used is the date the ticket was closed.
- The RUN REPORT button is used to apply the parameter changes you’ve selected to the report. Use this button to update the report when any parameter on the screen changes (eg: dates, or chart type or filters). (Note: In prior versions this button was labeled APPLY FILTERS).
- Use the SAVE REPORT button to save a report for reuse later. This is useful when you have configured a report just the way you want it and need to quickly call it up without having to reconfigure the report parameters every time.
- Use the TYPE OF CHART drop-down to select a chart type. Generally you can choose one of the following:
- Bar chart
- Column chart
- Line chart
- Spline chart
- Area charts
- Stacked charts
- Tables showing the chart data will appear in this area
- Area 10 is the FILTER used to select whether to report on all tickets or just open or closed tickets. Most reports will default to showing just OPEN tickets but certain reports that analyze closed reports will default to CLOSED.
- Area 11 is the filter used to select the individual statuses that can appear in or filter the data used for a report. The default is to use all statuses
- All items below area 11 are additional filters for the report that can be used to further restrict the data selected for the report
To run or re-run a report with your filter and dimension, just click the RUN REPORT button.
More Topics In Reports and Statistics
- Advanced Reports and Statistics
- Installation (Reports and Statistics)
- Overview (Reports and Statistics)
- Report Dashboard Overview
- Filtering Reports (Standard and Custom Fields)
- Using The Second Dimension
- Saving Reports
- Report Ideas
- ADMIN: Security Roles For Reports
- ADMIN: Restrict Certain Users View Of The Data Based On Department
Search