New Features For Version 2.0
The following changes have been made for Version 2.0
New Reports
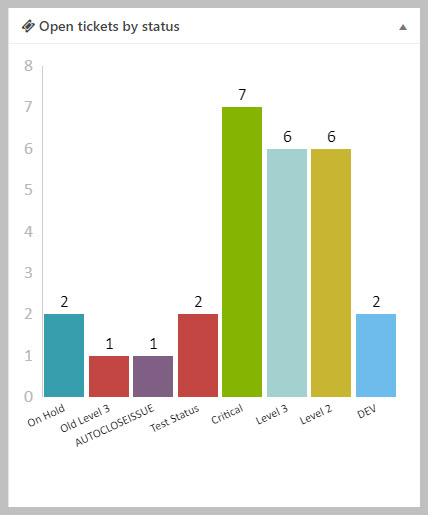
Summary Charts
These are new chart widgets that show one bar/data element for each item. For example, you will have a single chart that shows the number of open tickets for each priority. Each bar will be a single priority. Here is an example of such a report:
Detailed Reports
In addition to detailed reports for open tickets by product and agent, we now have them for
- PRIORITY
- CHANNEL
- DEPARTMENT.
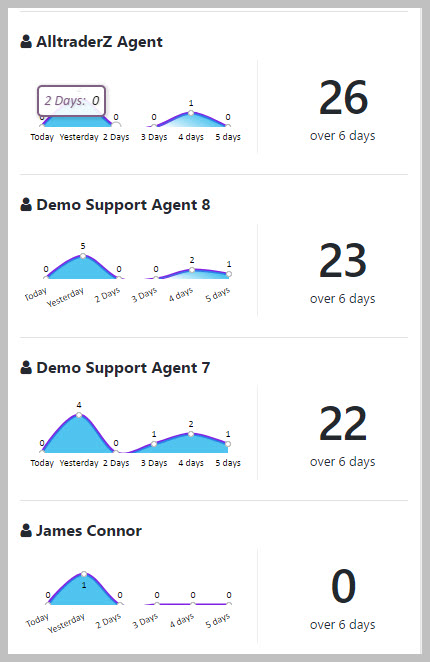
Additionally, all of the detailed reports now have new options for changing the chart type and colors. So now you can view detailed charts such as this instead of just the plain line charts.
Other Key Enhancements and Changes
- Ability to select chart types for all charts
- Tool tips are now added to all charts
- New SETTINGS tabs (3 of them) in TICKETS->SETTINGS
- Modified the status report widget to not show zero values to save space real-estate
- Fix to return the correct product name when syncing is turned on
Search