Configure Widgets
The Admin Report Widgets include an extensive set of options that control how they are displayed. In particular you can control:
- Which reports and charts are shown in the dashboard.
- The type of chart for each chart widget
- The colors used in the charts
- Some other misc elements such as whether or not the axis are shown and the size of the x-axis font.
The Configuration Tabs
Because there are numerous options for each widget, the configuration options have been broken out into three tabs:
- Report Widgets #1: Controls the visibility and options for the “detailed” reports – these are primarily the reports you saw in version 1.0 except now you have many more options
- Report Widgets #2: Controls the visibility and options for the “summary” charts – these are reports that are new to version 2.0
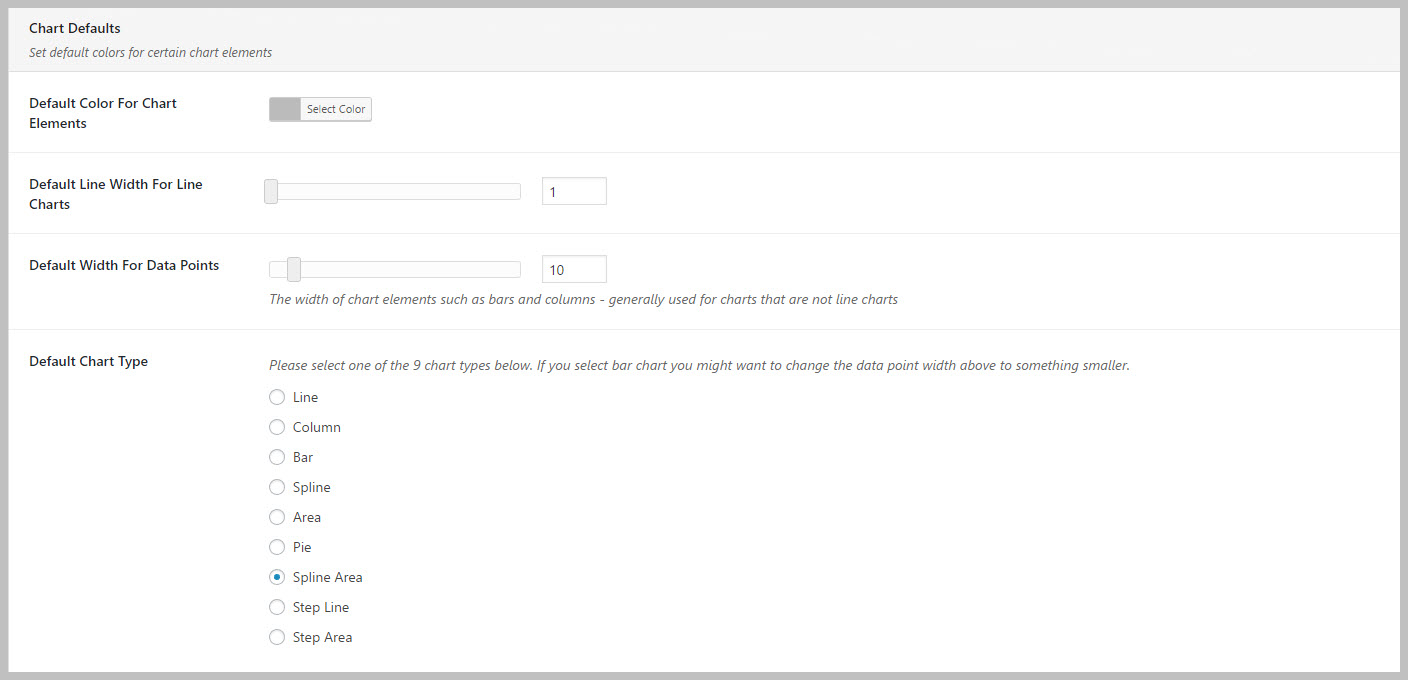
- Report Widgets #3: Contains default options for charts. These primarily affect the “detailed”chart reports since those do not have many individual options.
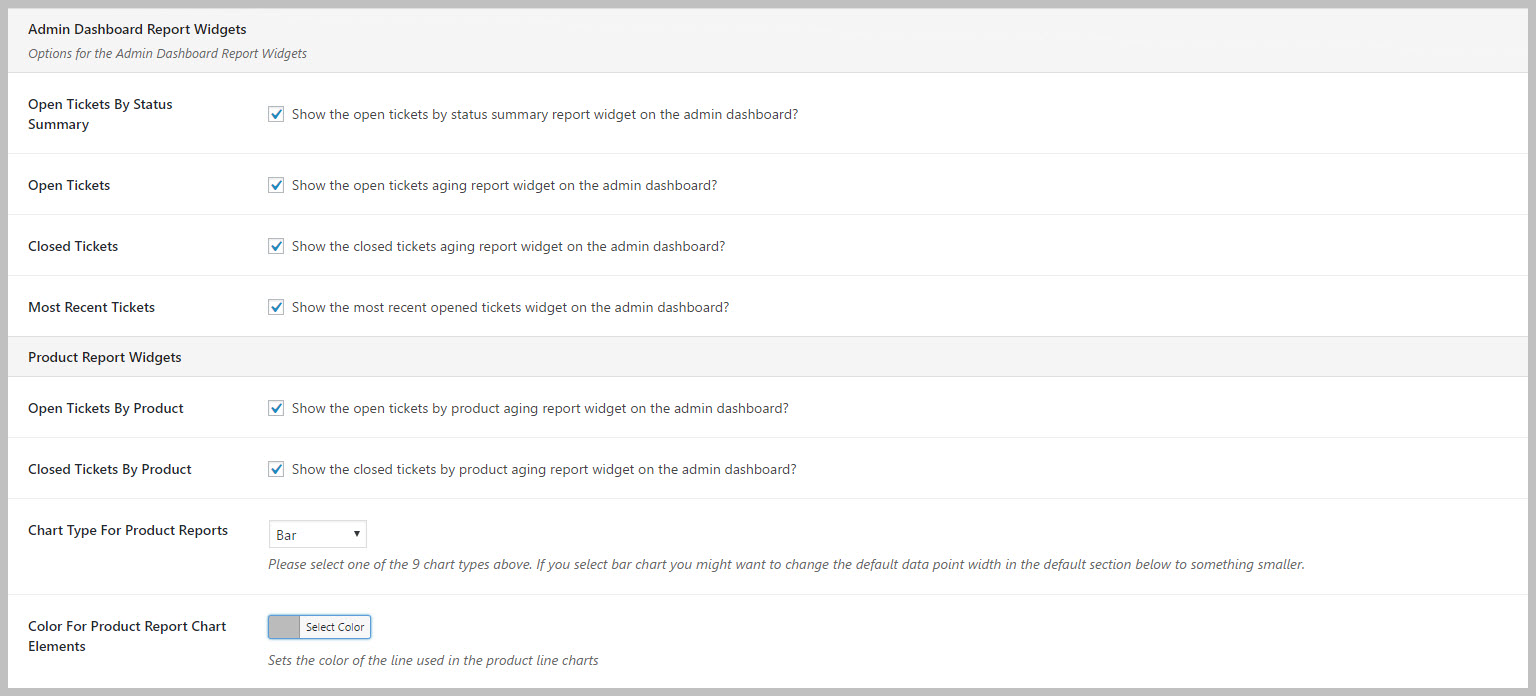
Enable/Disable Widgets
You can enable and disable widgets that you never use. This is recommended because each widget will consume resources every time you view your WordPress admin dashboard.
- Go to the TICKETS->SETTINGS->REPORT WIDGETS tabs
- Enable/Disable the checkbox next to the widgets you would like to view / hide
- Click the SAVE CHANGES button at the bottom of the screen
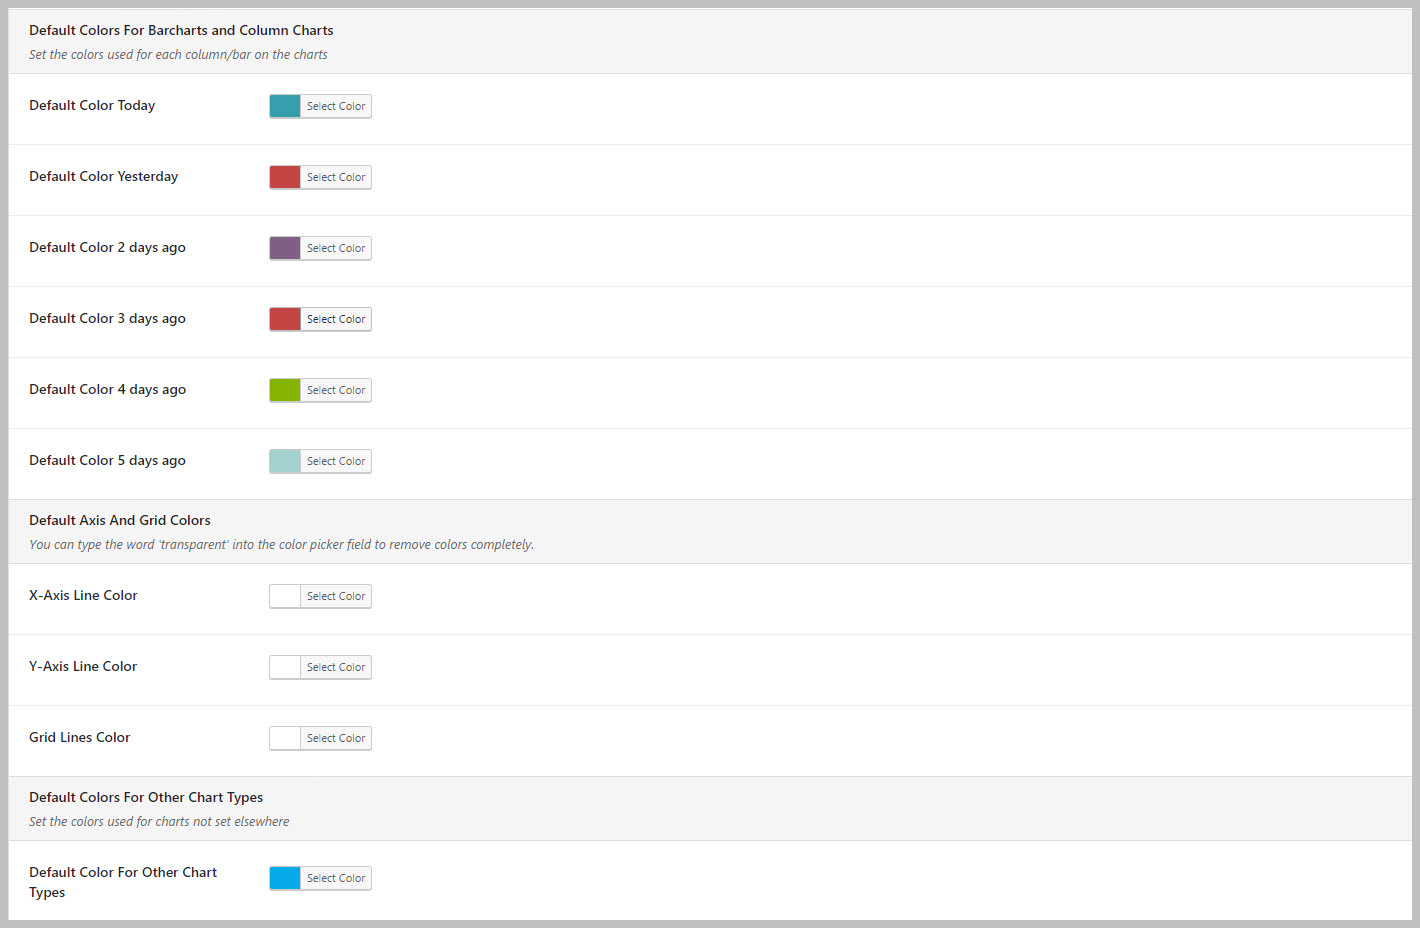
Change Colors For Charts
- Go to the TICKETS->SETTINGS->REPORT WIDGETS tab
- Change the colors for the various elements shown
- Click the SAVE CHANGES button at the bottom of the screen
Change The Chart Types
- Go to the TICKETS->SETTINGS->REPORT WIDGETS tab
- Change the chart types – you can set a default chart type and specify specific types for the PRODUCT, AGENT, PRIORITY and CHANNEL widgets
- Click the SAVE CHANGES button at the bottom of the screen
Search