Advanced Reports And Statistics (Early Release)
Do you run a support operation with multiple agents and need to track performance and other metrics? If so, this is the add-on you need. Slice, dice and filter your data to get insights into how your agents are performing or how much your clients are using your support services. Need to identify the top users of your support services? Or how about the agents that close the most number of tickets in a given time period?
Starting from a core set of six reports you can filter and break down your data using any piece of information on your ticket – including your custom fields. There is no other WordPress help-desk plugin that provide this level reporting detail or flexibility.
Core Reports
Six core reports are included – however, this is just the start. With these core reports you can slice and dice the data to create hundreds of reports. The core reports are:
- Ticket counts: Counts of tickets by status
- Productivity Analysis: Shows the average number of replies needed to close a ticket. Also shows the maximum and median.
- Resolution Analysis: Displays the average and median time in minutes it takes to close a ticket
- Delay Analysis: Displays the average time it takes to send the first reply to a ticket and the average time it takes for all replies.
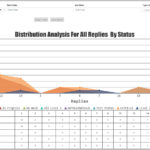
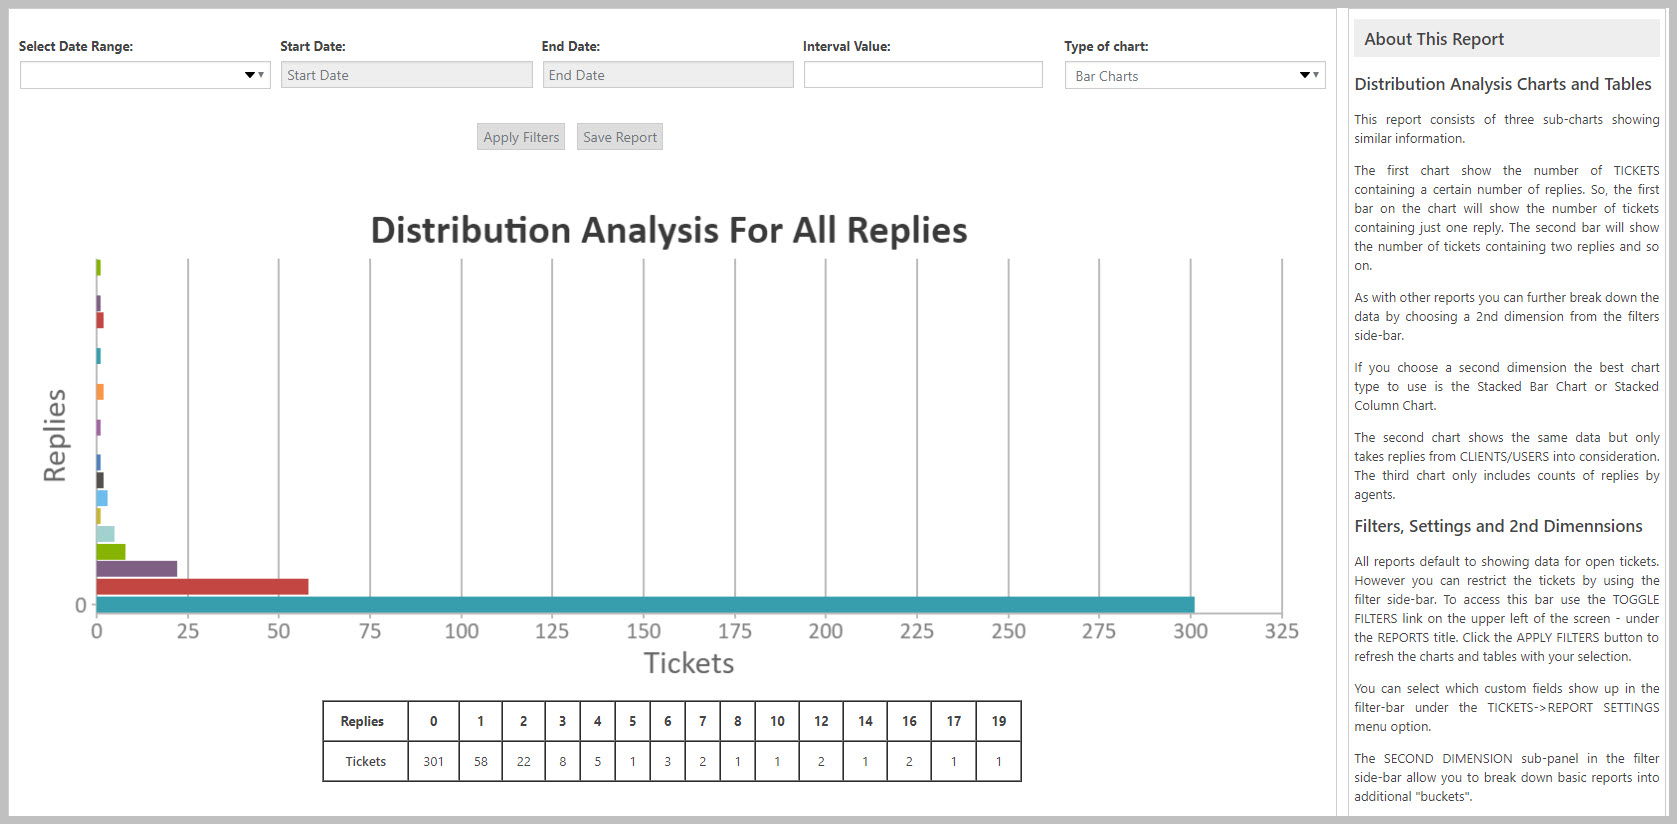
- Distribution Analysis: Shows the number of tickets that contains 1, 2, 3,…n number of replies.
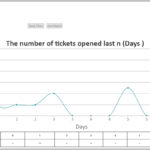
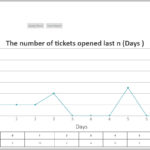
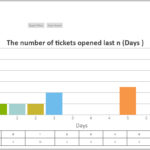
- Trend Analysis: Displays the number of tickets opened/closed in the last 7 days, 7 weeks and 7 months.
Charts and Tables
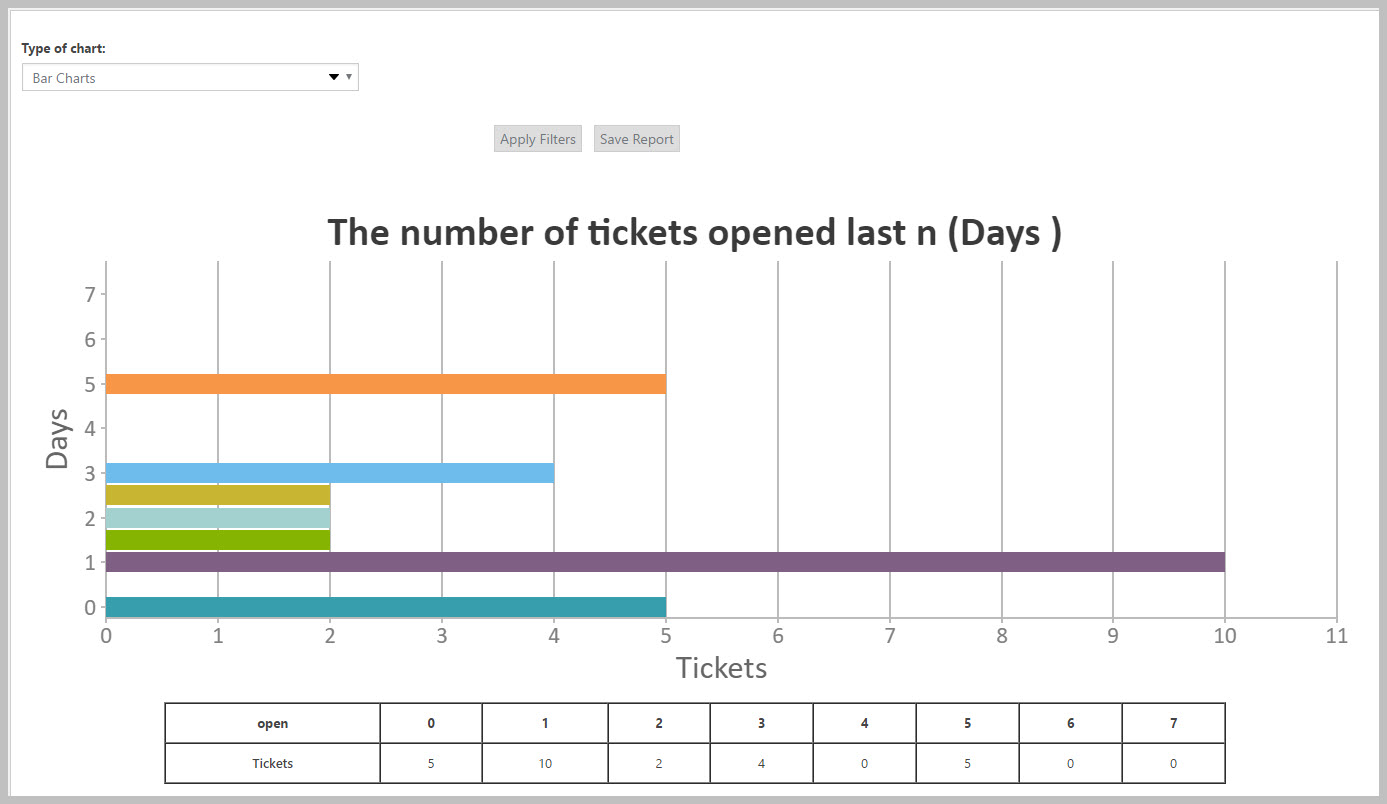
Each report is shown primarily in a chart format with a table of the data directly beneath it. Here is an example:
Multiple Chart Types
Each report can be displayed in one of up to 9 chart types:
- Bar chart
- Column chart
- Line chart
- Spline chart
- Area chart
- Area spline chart
- Stacked column chart
- Stacked area chart
- Stacked bar chart
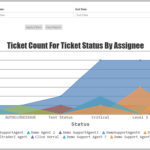
Some chart types are only available to certain reports and other chart types might only be available when multiple dimensions of data are used. The gallery below shows an example of each chart type:
Slice, Dice And Filter
The true power of this add-on is the ability to break the data down by an additional dimension and to filter the data by just about any data element present in the tickets database including your custom fields.
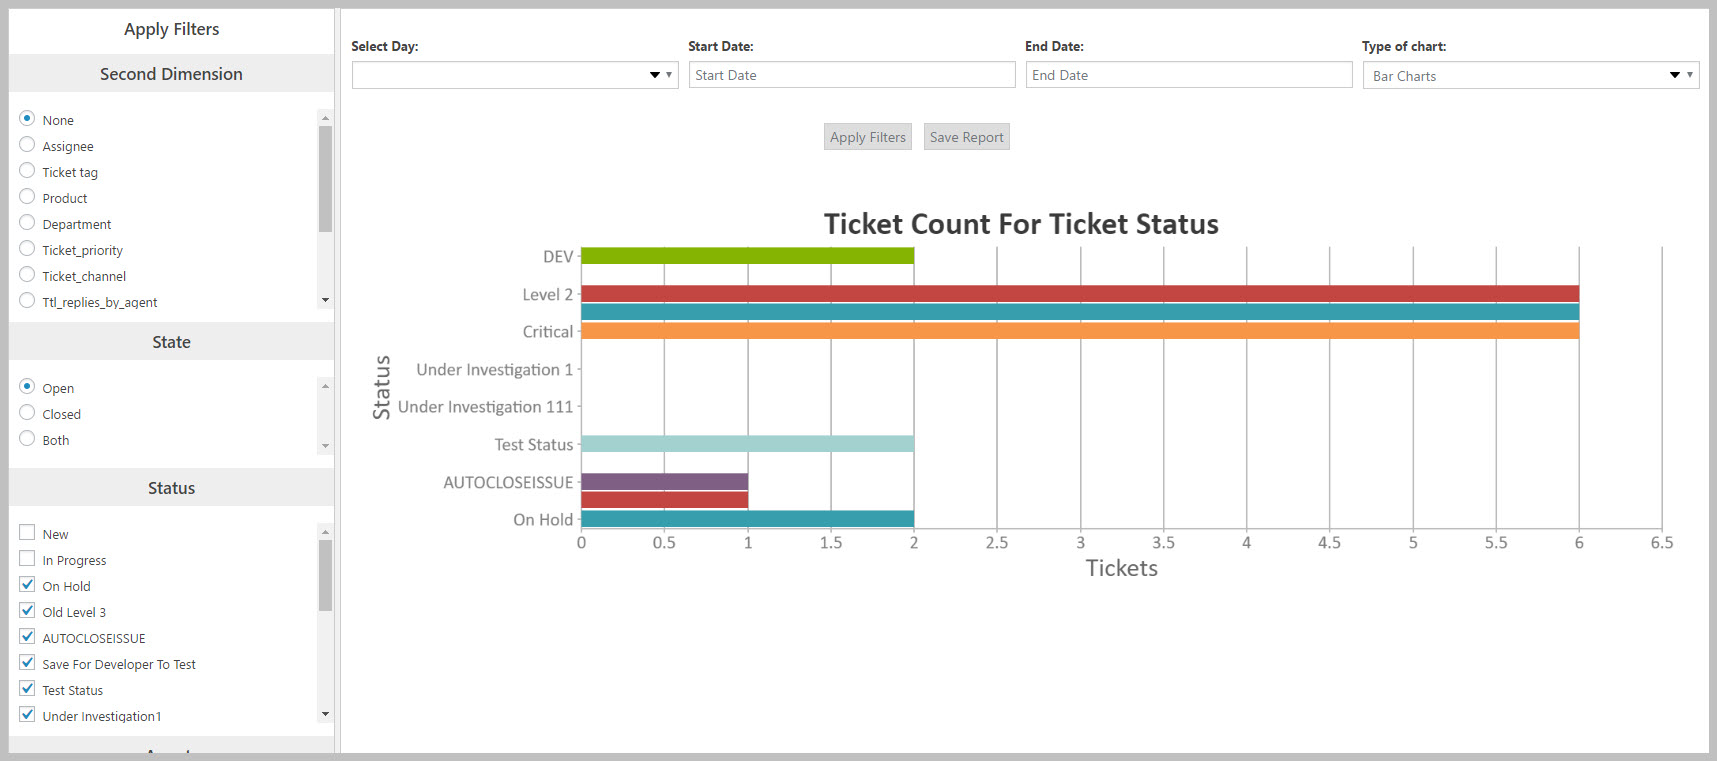
The following image shows the entire report screen with the side panel. The side panel on the left slides out as needed and includes both the ability to select an additional dimension on which to breakdown the data as well as selections for filtering the data. The image shows that only certain ticket statuses have been selected for the report.
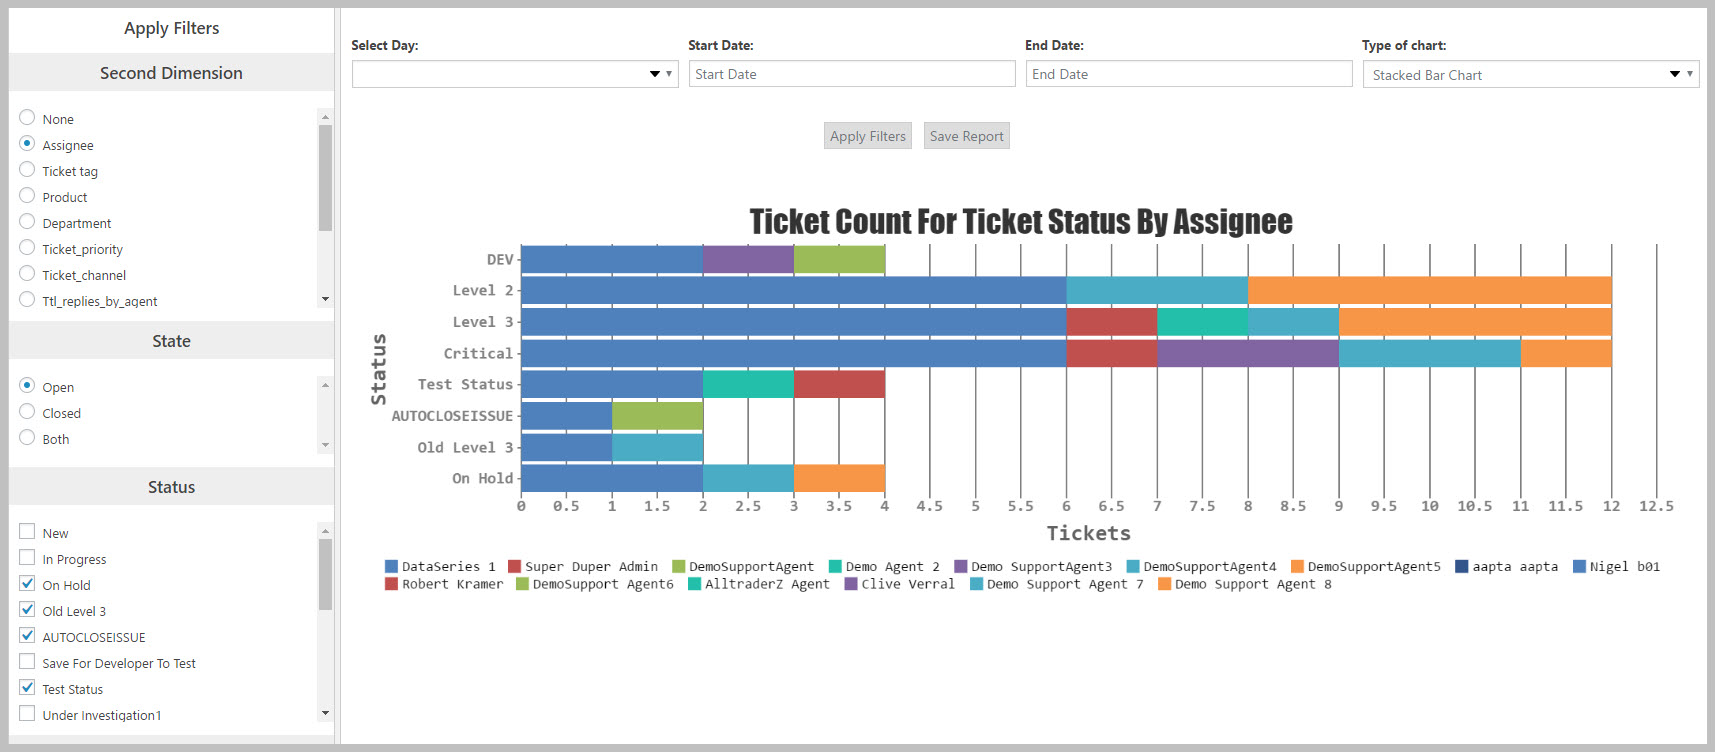
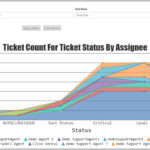
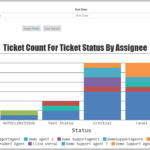
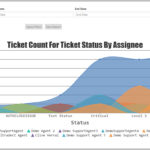
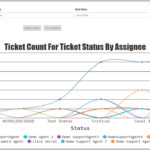
The data in the report is a simple count of number of tickets by status. Now lets see what that looks like if we break down the data by one additional dimension (what we call the “second dimension”). We will choose the “assignee” as the second dimension (“assignee” is the agent assigned to the ticket). The report now looks like this:
As you can see the data is now broken down by agent which is very useful – you can start to compare agents with each other to gain insights into your operations.
You can use the second dimension to break-down the report by:
- Product
- Department
- Tags
- Priority
- Channel
- Agent
- Any custom field that you create
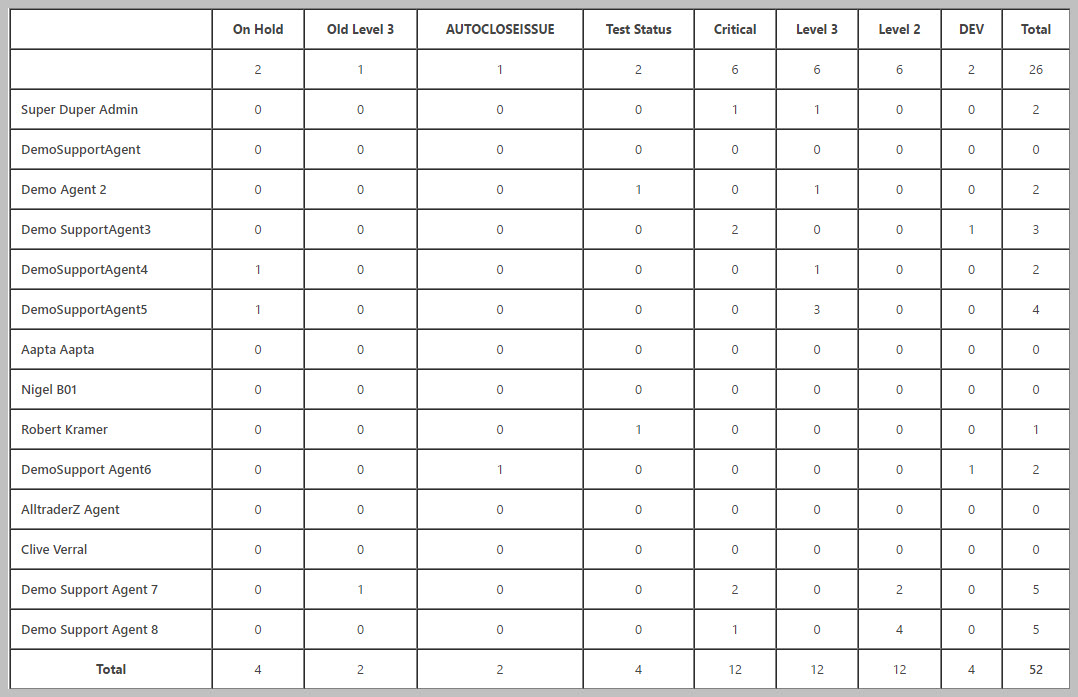
Below is the table for the chart above:
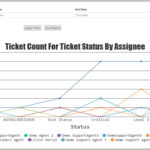
Here are the views for some of the other chart types using the same data:
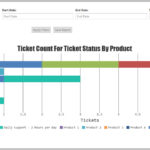
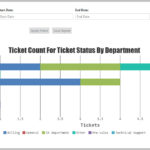
Here are three other dimensions for the same data – product, department and priority. (Keep in mind that in our database not all tickets contain product data or department data or priority data.)
Saving And Sharing Reports
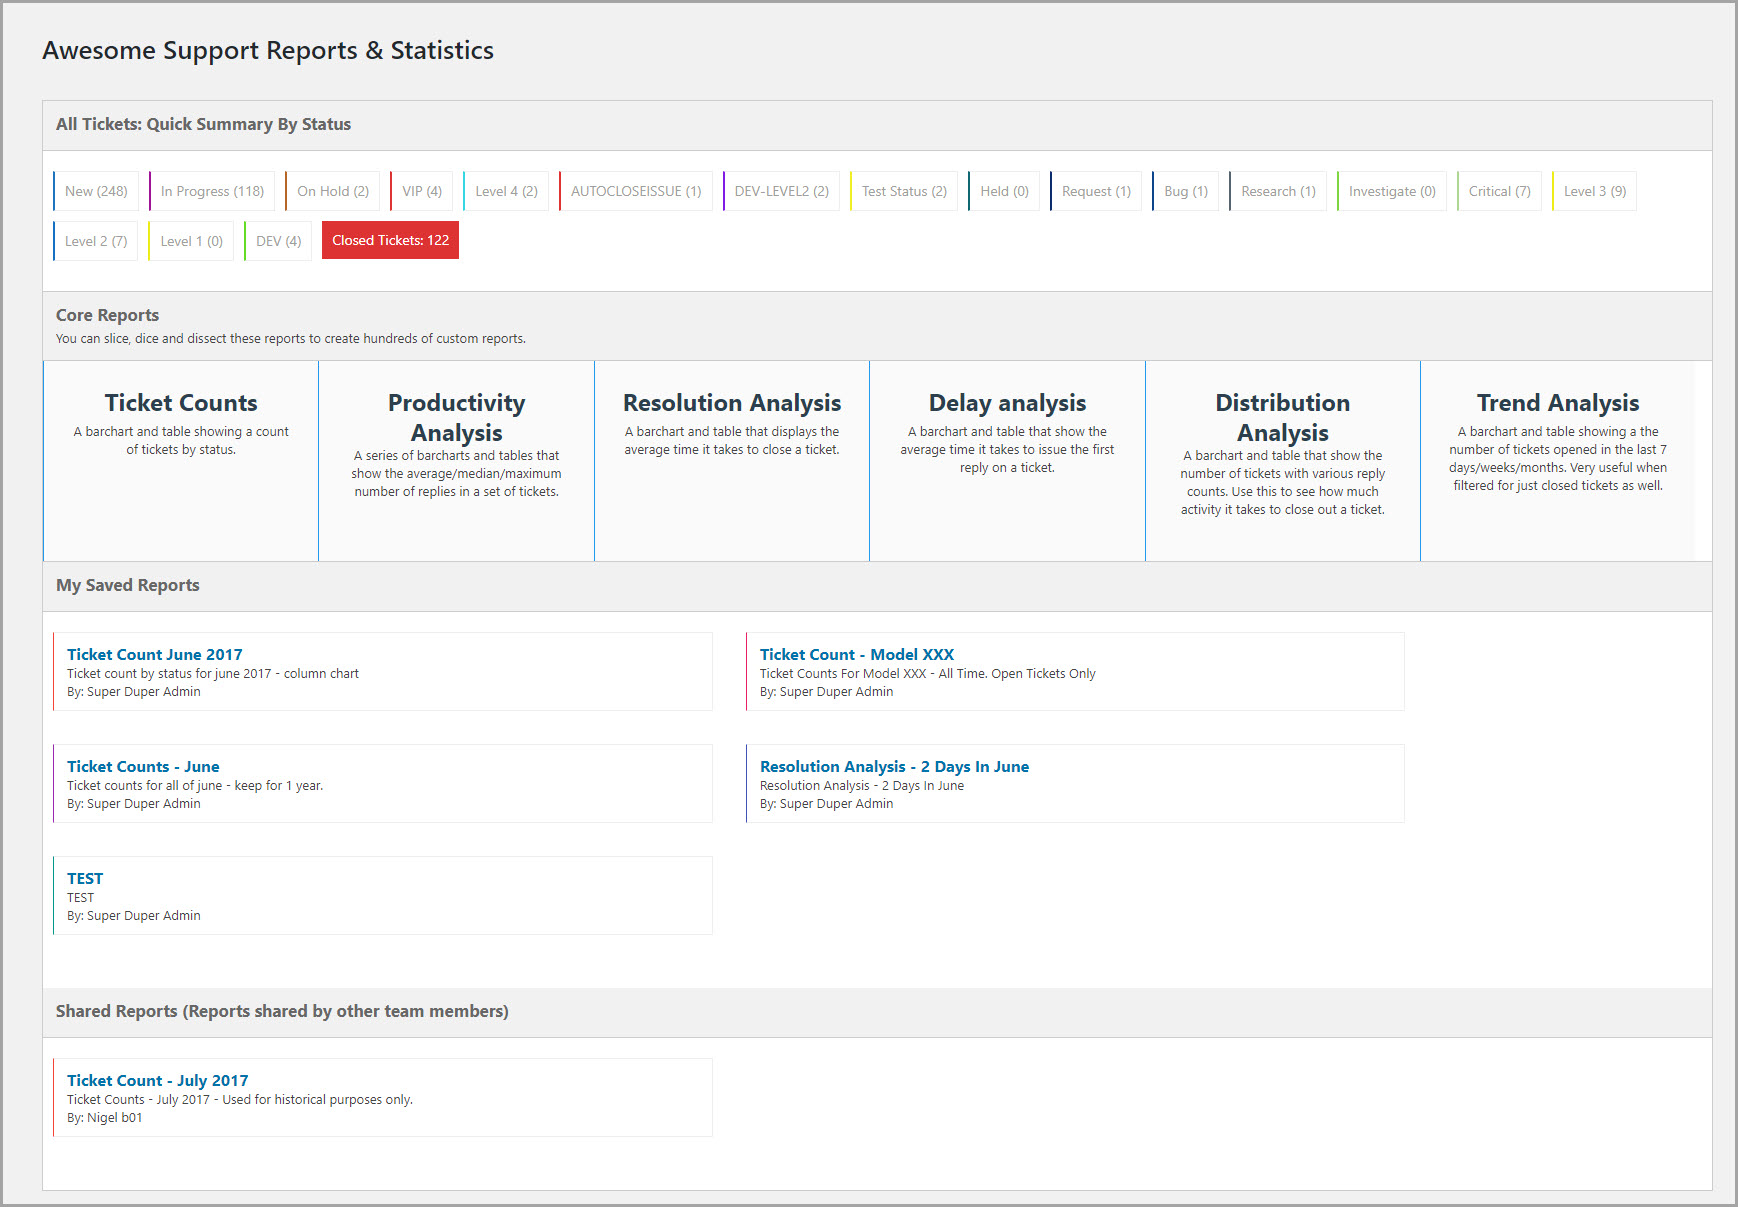
Admins can control who can run, save and view reports. Saved reports show up on the reports landing page – see image below:
Extensive Help
Each report has extensive help screens so you can make the most of your data:
Early Release Notice
Purchase options
Basic System Requirements
- WordPress Version 4.9 or later
- Awesome Support Version 5.8.0 or later
- PHP 7.1 (7.3 or later recommended)
Additional Requirements
There are no additional requirements for this item.
Documentation
Purchase options
RELATED ITEMS
The items below are great complements to this product!
Recurring Subscription Notification
The pricing for this (and most other add-ons) is set as a subscription by default. However, you are free to cancel the recurring subscription at any time – you will still be entitled to the one year of free updates and support from the time of your last payment. The software will generally continue to work without additional payments. However, you should be aware that, as with all software, a future update of any of WordPress / Awesome Support Free Core could include a breaking change. At that time, if you are not on a subscription plan, you will need to purchase a new license to obtain the compatibility updates necessary for the product to continue to work.
To cancel your subscription:
- Credit card or stripe users- just go to your MY ACCOUNT page on our website.
- Paypal users - cancel from directly inside your Paypal account.
This notice does not apply to service products such as custom programming or to free plugins.
Related Articles and Videos
Unfortunately no related articles are available for this product right now.

